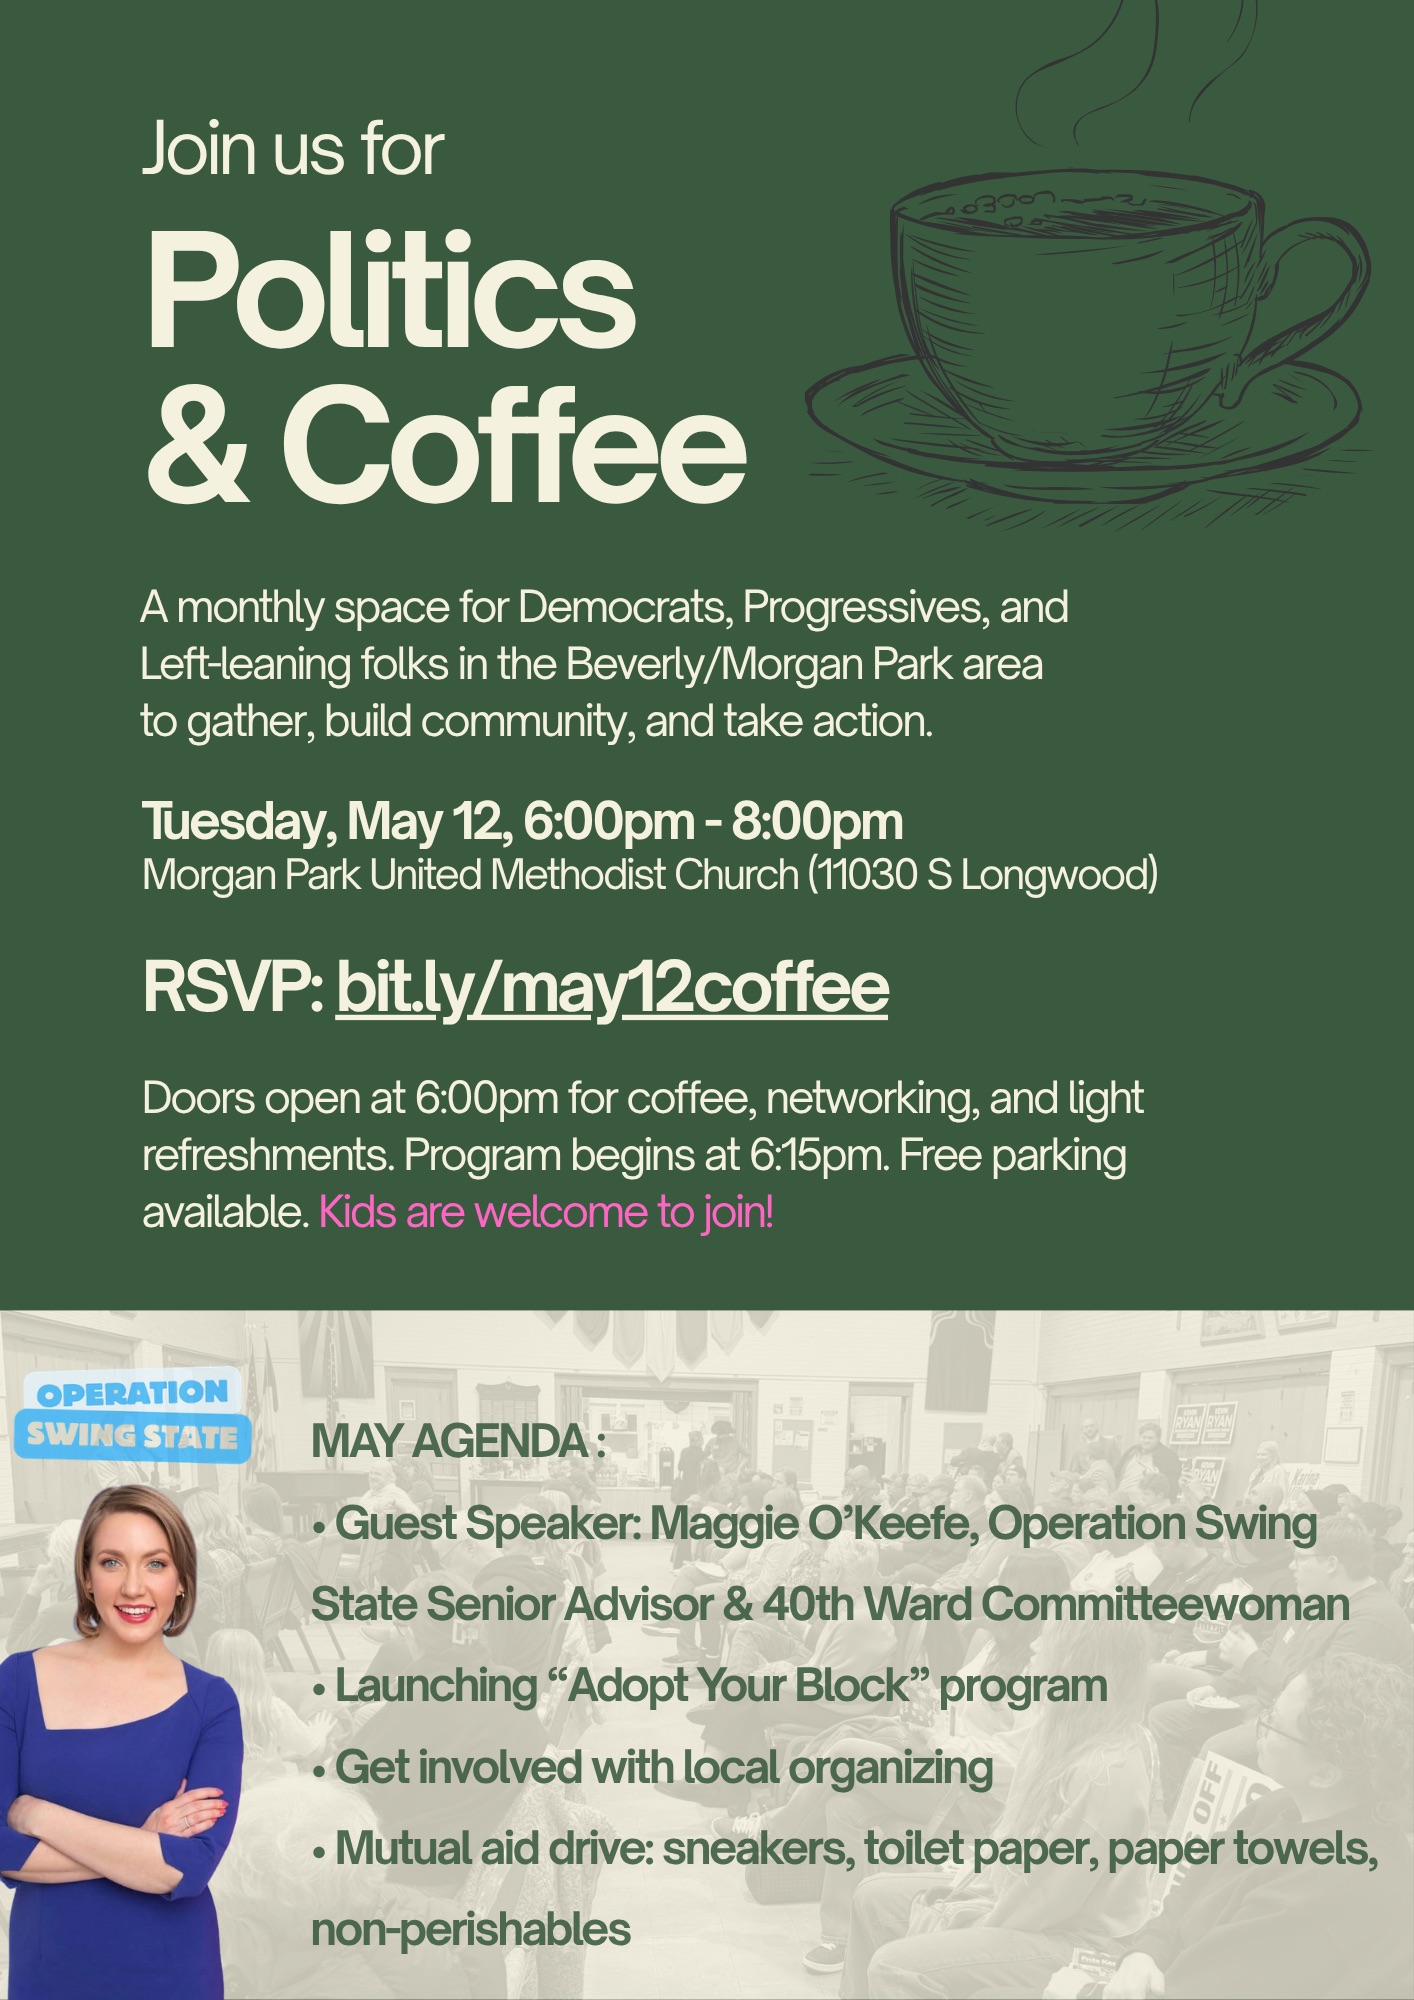
 I’ve recently gotten involved with Politics and Coffee, a group that brings together progressives, liberals, and Democrats from the Beverly / Morgan Park area and other parts beyond. Its first few meetings functioned as both a space for people to meet and exchange ideas and as a candidate forum ahead of the March 2026 primary. Since then the group has looked at ways to mobilize volunteers around politics and mutual aid. Our next meeting is this Tuesday, May 12th at 6pm (RSVP here) where we’ll hear from a senior advisor with Operation Swing State, collect sneakers and paper products for mutual aid groups, and talk about an “Adopt Your Block” program to encourage more neighborhood civic engagement.
At the last meeting, I shared some voting data I’d put together about the March 2026 primary. While I didn’t look at every race on the ballot, I looked at the ones that got the most attention.
Some caveats and disclaimers:
For the most part, I’m letting the data tell the story. The below is based on publicly available voting data from the Chicago Board of Elections (with a little Countywide data where applicable). In the rare instances where I offer some kind of analysis I make it clear I’m speculating because we don’t have exit polls or other data-driven analysis to explain things. (I’ve done my fair share of political punditry in the past but not today.)
I’m also not trying to speculate on things that I haven’t looked at in the data. One question I still have is what kind of voters these were – were they more likely to vote for progressive Dems or more centrist / conservative Dems? With the 19th Ward being one of the few racially-mixed areas of the city, I’m also curious about how racial demographics affected these results, if at all.
With that said, I did pull this all into a dashboard using Claude, the AI tool, to make it easier to read, navigate, and dig deeper into the data if that’s your thing. I am, at most, an occasional user of AI and this was my first major application of it and I used it because I am not a designer or coder. I did not ask it to think and nothing in the dashboard or graphics is speculative. It’s just making the data prettier than looking at a bunch of spreadsheets. Click the images to embiggen.
Turnout
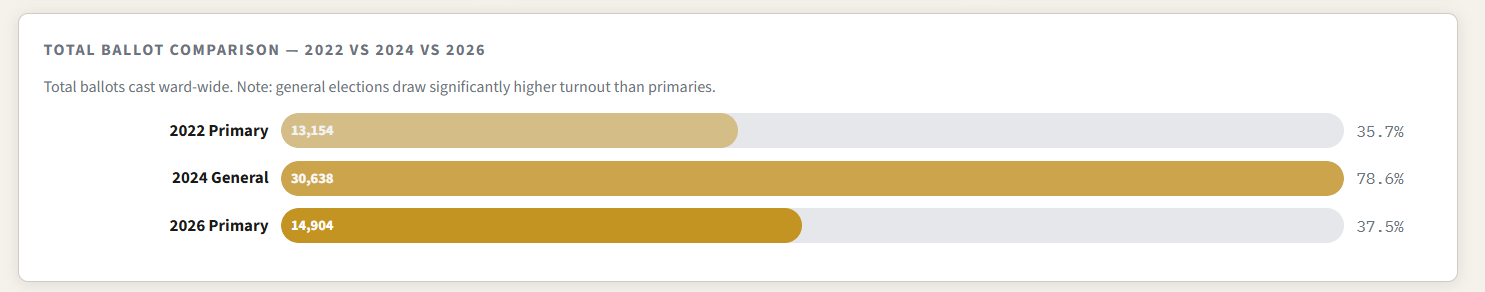
Unlike other areas of the city and suburbs, voter turnout (how many people voted compared to how many registered voters there are) was up in the 19th Ward compared to the 2022 primary. That’s good! The 19th Ward had 38% turnout last month compared to 36% in 2022. (City of Chicago turnout was 24% citywide.)
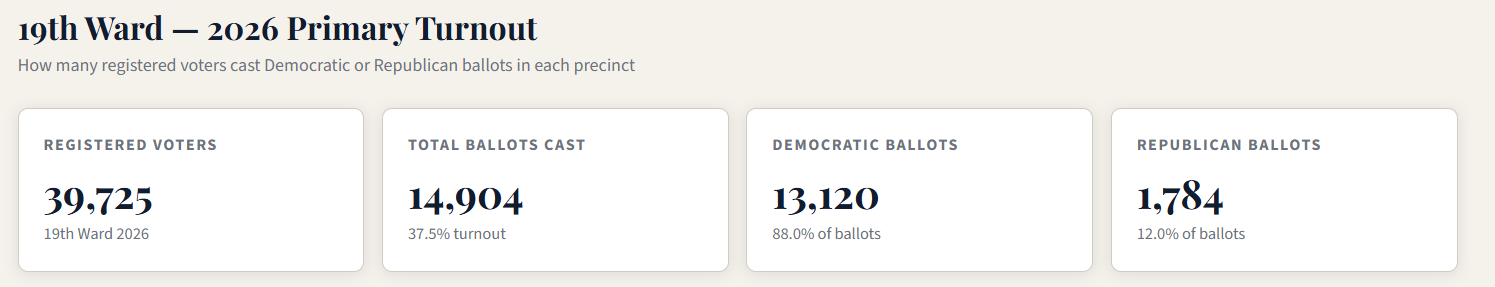
The number of Dem ballots rose while Republican ballots fell. The Democratic share of all primary ballots went up 12 percentage points. Why? One reason might be that Biden was in office in 2022 and Trump is in office now. That’s been a typical turnout pattern in the last few elections.
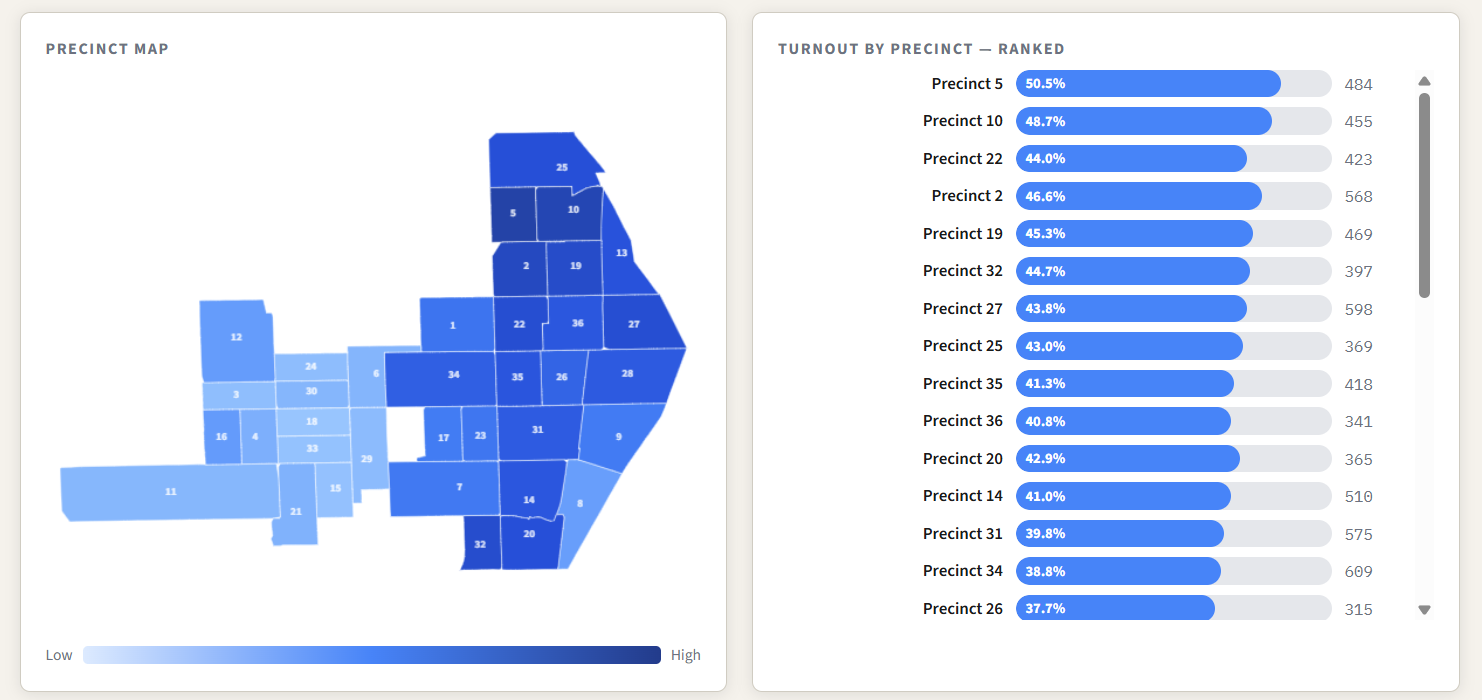
Most of the people voting in this primary were pulling Democratic ballots, even in the western part of the ward that skews Republican. The below graphics show the 15 precincts with the highest turnout while the dashboard shows ballot counts for all 36 precincts in the ward. Total turnout is in yellow, Democrat ballots are in blue, and Republican ballots are in red.
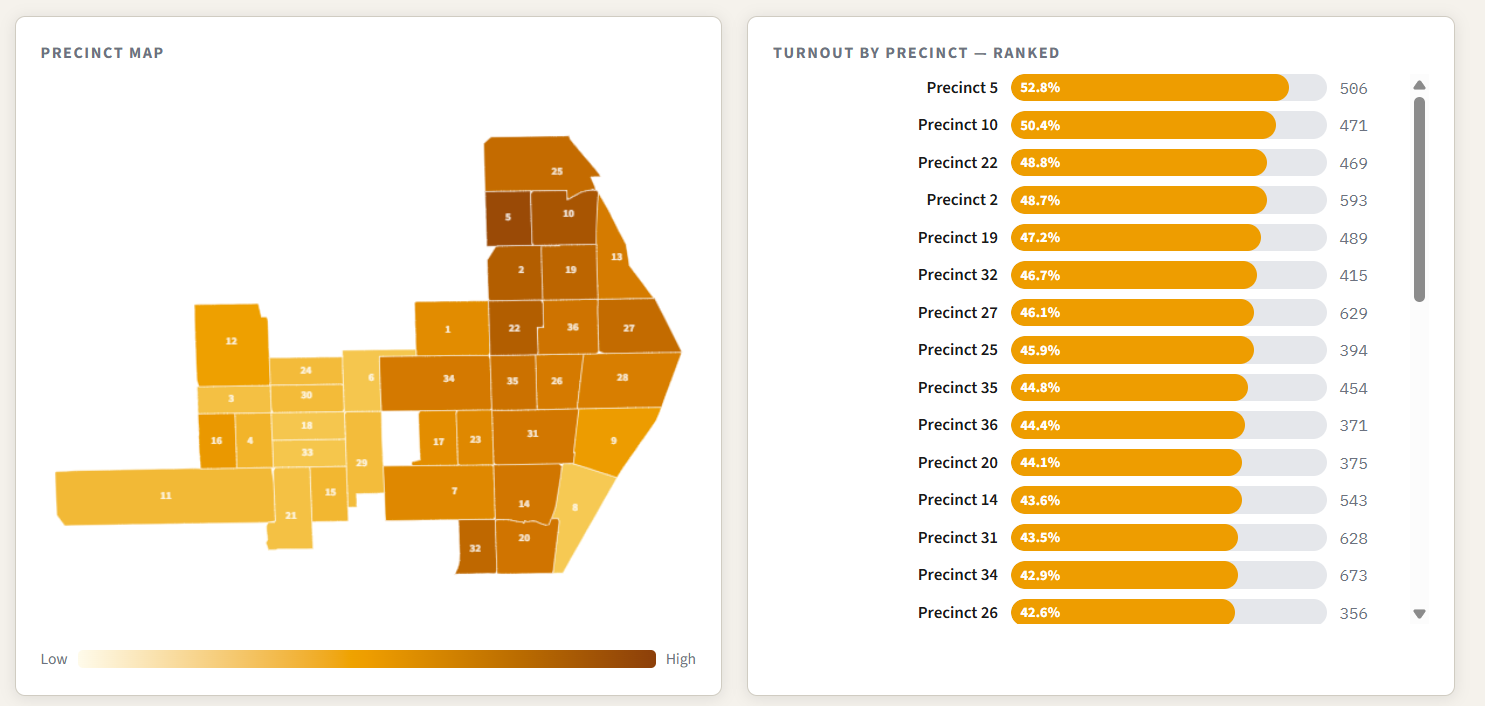
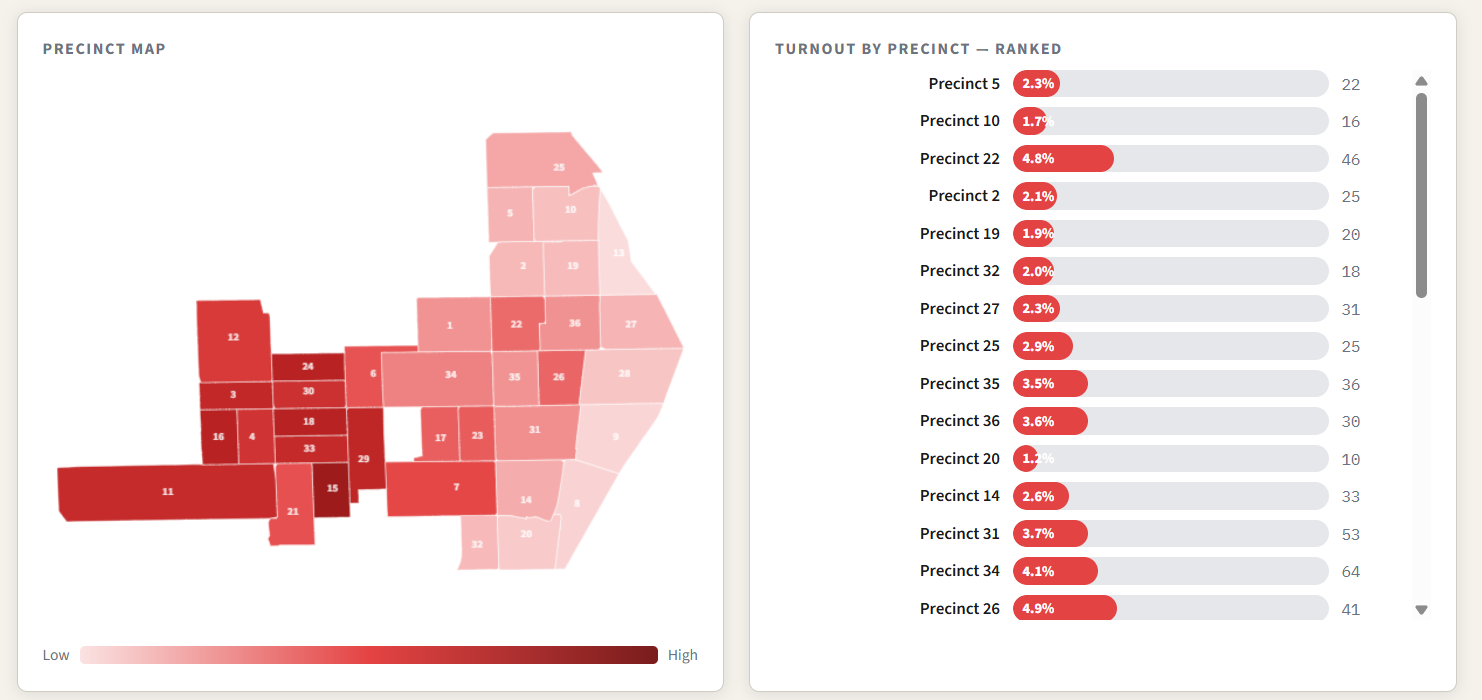
If you look at total turnout within precincts, the only place where the total number of Republicans reaches 10% of total turnout is in precinct 15 (from 111th to 115th between Homan and Kedzie). The largest number of individual Republican ballots was precinct 29 (107th to 111th between Kedzie and the Grand Trunk railroad tracks) but because more Dems voted there the total Republican turnout is only 8.2%.
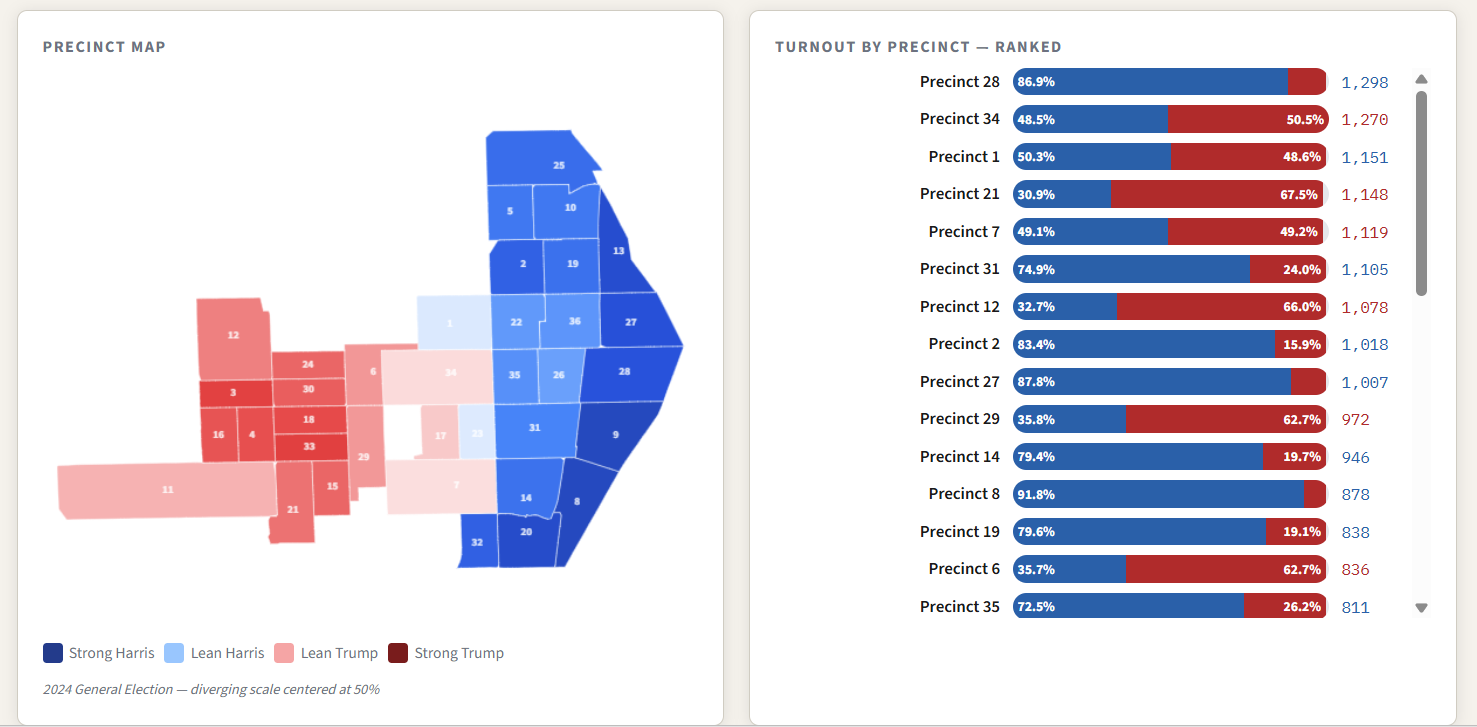
But! This does not necessarily mean all these precincts vote majority Democrat in a presidential election. If you look at the Harris vs. Trump tab in the dashboard or in the graphic below, you’ll see that even precincts that have more Democratic ballots than Republican ballots in a primary still vote majority Trump.
Of course, turnout looks way different in a presidential election. The dashboard has a tab that compares 2022 vs. 2024 vs. 2026 by precinct but here’s what the total turnout looked like in the 19th Ward.
Down-ballot Dropoff
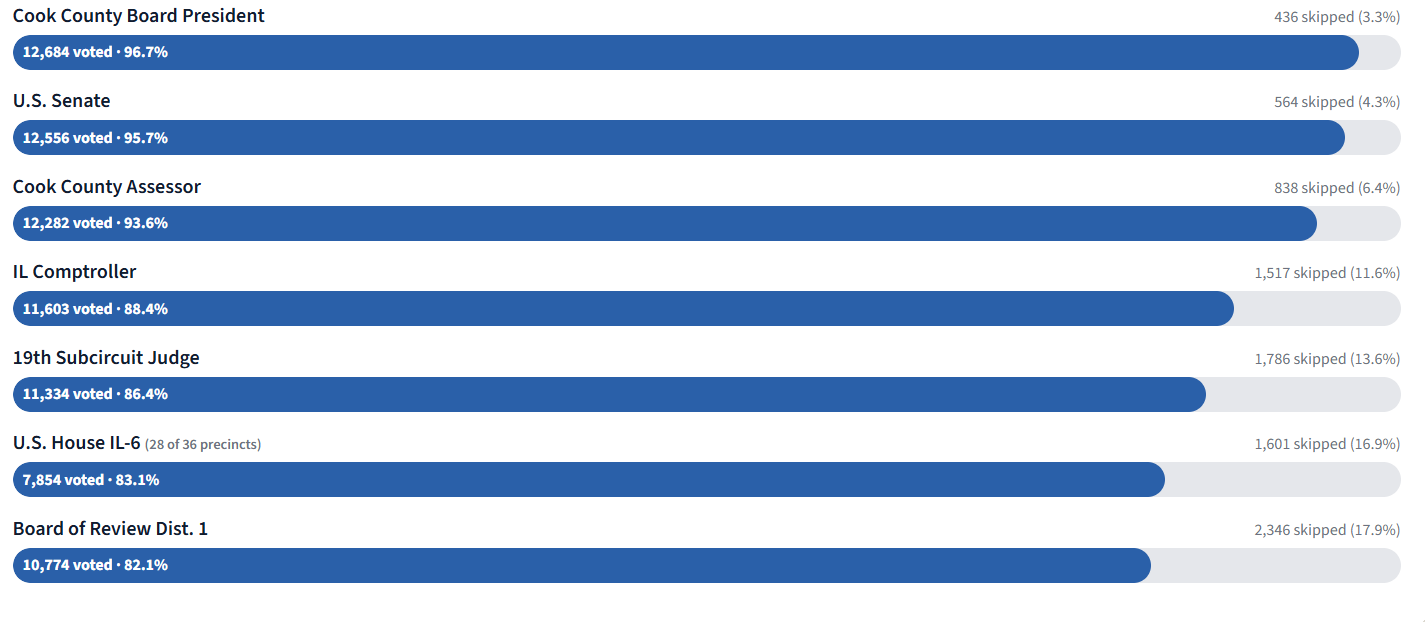
As in any election, the further down you go down the ballot, the fewer people you see voting in those races because people are less interested or informed about individual districts or judicial races. This is referred to as undervoting or dropoff.
This election was no different but an interesting thing happened. Normally, the higher the placement on the ballot, the more participation there is. Not in our ward. More people voting Democrat skipped the U.S. Senate race (4.3%) than skipped the Cook County Board President race (3.3%) even though the former was higher up on the ballot. (This does NOT include Republican ballots since there wasn’t a Republican candidate for that race.)
 Why did this happen? This is pure speculation but I’d guess that the leading U.S. Senate candidates were all running on anti-Trump or progressive platforms that did not appeal to the more conservative Democratic voters in our ward whereas they saw Brendan Reilly as more of an acceptable alternative to the progressive politics of Toni Preckwinkle and therefore wanted to participate in that race more.
Race-by-Race Results
The race maps in the dashboard show where various candidates got the most votes. In cases where there are only two candidates, I’ve shaded the maps to show where they got the most votes. This helps to see other patterns in the data where candidates won all precincts (Croke for Comptroller and Hynes for Assessor) or where one candidate dominated (Cardenas for Board of Review).
A note on the Board of Review race: Juanita Irizarry won two precincts but by very slim margins. In one precinct, it was by only two votes.
From these maps, we can see that Congressman Sean Casten easily won the 19th Ward for IL-6, Margaret Croke handily won for Comptroller and Pat Hynes (nephew of former Assessor, Illinois state senator, and 19th Ward committeeman Tom Hynes) won for Assessor.
Some other notes:
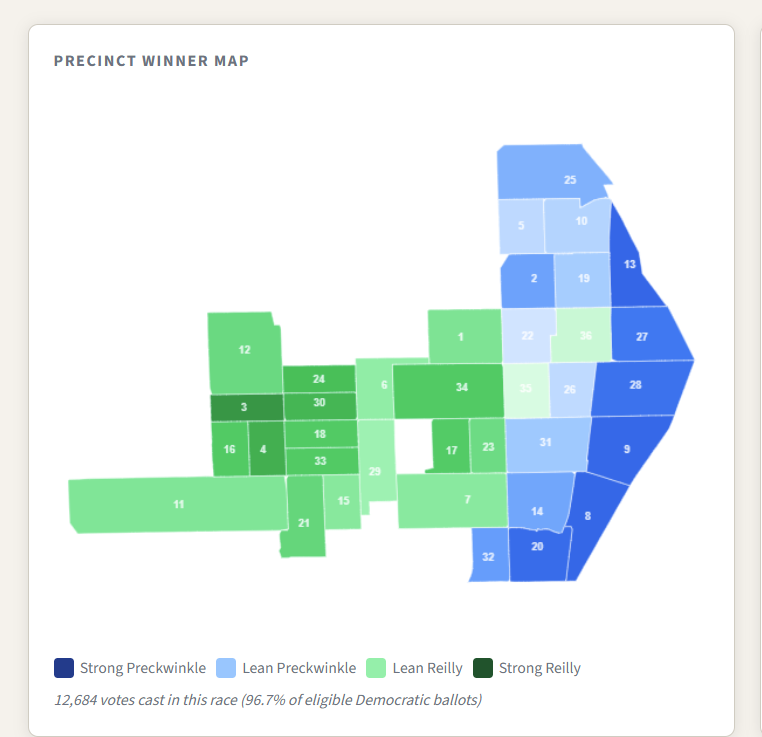
Cook County Board President: Western Ave is usually the conservative / progressive Democrat dividing line here, but Precinct 32 is the rare precinct west of western that has been reliably voting for progressive candidates recently. So while the Cook County Board President race mostly split along the conservative / progressive precincts in the ward, Reilly did win two precincts east of Western, but by very slim margins (nine votes in P35 and 26 votes in P36).
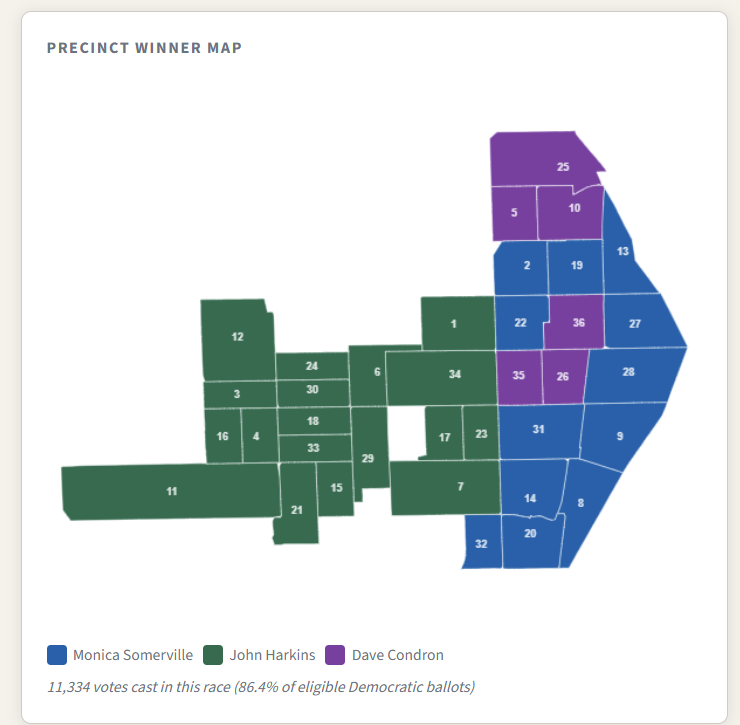
19th Judicial Subcircuit: There are a couple interesting results here. Signs for John Harkins were everywhere in the ward, which reflected both the 19th Ward organization’s heavy support for him as well as his ties to family and friends here. But he only won the precincts west of Western Avenue. Monica Somerville won most of the precincts east of Western while Dave Condron won six precincts east of Western, including the two precincts that voted for Reilly for Board President. Why the overlap there? Without exit polls or other data, we don’t know, but perhaps Condron’s work with the Cook County State’s Attorney may have activated some conservative or policy-focused voters in these precincts. (There’s a tab in the dashboard that shows the full 19th Judicial Subcircuit results rather than just the ward results.)
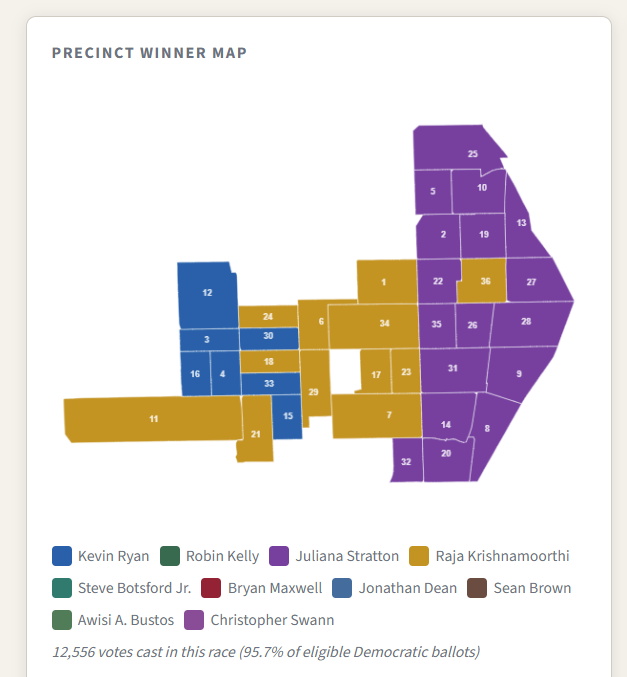
U.S. Senate: Finally, it seems worth noting that the seven precincts that voted for Kevin Ryan in the U.S. Senate were in the most conservative / Republican parts of the ward. On the surface, this makes no sense. Why would these precincts vote for a progressive Democrat who wants to abolish ICE, pass “Medicare for all” and pass the Green New Deal?
Again, this is speculation, but it may be because the three “frontrunners” in the U.S. Senate race were all running on some kind of anti-Trump / progressive platform, which many voters were aware of. If you’re a more conservative voter, you might scan that list of candidates, decide they’re not to your liking, and pick the candidate with the very Irish-sounding name and be done with it. Also, Ryan was the first name listed on the ballot for that race and that typically gives candidates a slight bump.
I’m curious what other people think about this data or what other data you might like to see. Feel free to leave a comment.
Interested in attending Politics and Coffee? RSVP here.
Great post! And excellent use of Claude.
Absolutely did not expect to see candidates higher up on the ballot skipped over. This will be an interesting pattern to monitor elsewhere, moving forward.
Would love more details on the “Adopt Your Block” program in coming posts. What it is, but also, strategies for HOW to implement neighborhood programs focused on civic engagement.
Keep at it!
We’ll be talking about it at that meeting on Tuesday. But will keep this in mind for a future topic.